How to Pick the Correct Kentucky Derby Winner
The Puzzle of the Kentucky Derby
Every spring, on the first Saturday in May, the world turns its eyes toward Churchill Downs. The Kentucky Derby is America’s most celebrated horse race, a mile and a quarter test of 3-year-olds that combines speed, stamina, tactics, and no small dose of chaos.
Handicapping the Derby has always been one of racing’s great challenges. You’re faced with a bulky field (often 18–20 horses), diverse prep paths, lightly raced colts, and a mountain of hype. Unlike older handicaps where horses have longer records to assess, the Derby forces you to judge a horse’s future potential on the basis of limited data.
So how can you reliably pick the winner? While no formula guarantees success, decades of analysis — and the work of respected turf writers like Jennie Rees — have identified factors that sharply improve your odds. These include the Final Fractions Theory (FFT), the horse’s last prep race and finish position, and traditional class indicators such as Beyer Speed Figures.
In this article, we’ll explore these tools in depth, test them against history, and show how to synthesize them into a framework that helps you separate live contenders from “also-rans.”
Jennie Rees and the Final Fractions Theory
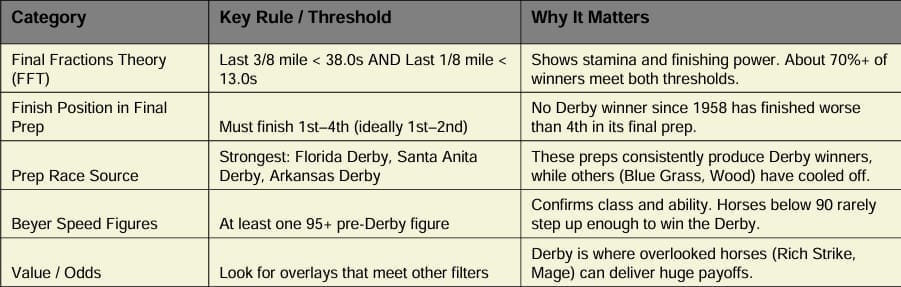
Jennie Rees, a decorated turf writer from Kentucky, popularized what is now widely known as the Final Fractions Theory (FFT). The idea is elegantly simple: focus on how a horse finishes in its last prep race at 1⅛ miles (nine furlongs).
Instead of just looking at the final time or the overall Beyer figure, FFT asks:
How fast did the horse run the final eighth (1 furlong)?
How fast did the horse run the final three-eighths (3 furlongs)?
The thresholds Rees identified:
Last 1/8 mile in 13.0 seconds or less
Last 3/8 mile in 38.0 seconds or less
A horse meeting both criteria is considered a prime Derby contender.
Why These Fractions Matter
The Derby is 1¼ miles — a furlong farther than the common 1⅛-mile preps. Many horses simply can’t sustain their speed beyond nine furlongs.
FFT acts as a stress test: only those finishing with energy at 1⅛ miles are likely to have the reserves to last the extra eighth of a mile on Derby Day.
In essence, FFT isolates stamina with speed. Horses that stagger home in 13.4 for the final eighth may still win shorter races, but the extra Derby distance exposes them.
Historical Validation
Rees and others have tracked Derby winners back decades. Results are striking:
19 of 26 Derby winners (through ~2018) met both thresholds.
26 of 29 met at least one.
Only a handful failed both — and those tended to win under highly unusual pace setups.
More recent evidence:
Mystik Dan (2024): closed his Arkansas Derby prep in 37.76 / 12.69 → passed both.
Sovereignty (2025): Florida Derby prep 37.12 / 12.47 → passed both.
Mage (2023): Florida Derby 38.17 / 13.19 → failed both. Mage’s win is a rare FFT miss.
Rich Strike (2022): Jeff Ruby 36.89 / 13.08 → passed 3/8, missed 1/8.
The pattern holds: winners overwhelmingly satisfy FFT in some form.
The Role of Beyer Speed Figures - What Beyers Measure
Introduced by Andrew Beyer in the 1970s, Beyer Speed Figures (BSFs) attempt to normalize final times across distances, tracks, and conditions. A 100 Beyer at Churchill is meant to represent roughly the same level of ability as a 100 Beyer at Aqueduct or Santa Anita.
For Derby contenders, Beyers are useful in assessing class and raw ability. Horses running sub-90 Beyers in preps rarely step up enough to win the Derby.
Beyer as a Filter, Not a Predictor
However, Beyers alone are imperfect Derby predictors. Consider:
Rich Strike (2022) entered the Derby with a best pre-Derby Beyer of only 84. Few took him seriously, yet he exploded at 80-1.
Mage (2023) had a modest pre-Derby Beyer (~95). Critics doubted his class. Yet he stormed home to win.
Contrast with Mystik Dan (2024), who already had cracked a 101 Beyer before the Derby. His quality was confirmed by the clock.
Lesson: while most Derby winners have run at least 95+ Beyers beforehand, enforcing a strict cutoff misses live bombs. Beyer works best as a minimum class screen combined with FFT.
The Importance of the Last Prep Race
Location Matters - Not all prep races are created equal. The Derby trail has dozens of stakes, but a handful of races consistently produce winners.
Florida Derby (Gulfstream Park): the single most prolific Derby prep in history. Recent winners include Sovereignty (2025), Mage (2023), Always Dreaming (2017), Nyquist (2016), and Orb (2013).
Santa Anita Derby: California’s crown jewel prep, producing Justify (2018), California Chrome (2014), and I’ll Have Another (2012).
Arkansas Derby: Hot Springs has become a powerhouse, producing American Pharoah (2015), Smarty Jones (2004), and Mystik Dan (2024).
Blue Grass (Keeneland): once dominant, now sporadic. Street Sense (2007) is its last major winner.
Wood Memorial (Aqueduct): highly productive mid-20th century, but mostly dormant since Funny Cide (2003).
Louisiana Derby (Fair Grounds): strong for exotics, weaker for outright winners (except Grindstone 1996).
Jeff Ruby Steaks (Turfway, synthetic): long ignored, but Rich Strike’s 2022 shocker proved it can’t be dismissed.
UAE Derby (Meydan): heavily hyped but still winless; yet horses like Mendelssohn (2018) and Forever Young (2024) keep it relevant.
Finish Position Patterns
History screams one message: Derby winners almost always finish top-4 in their last prep.
Since the 1950s, no horse finishing worse than 4th in its final prep has produced a Derby win payoff.
Since 1996, about 86% of winners were 1st or 2nd in their prep.
Rare exceptions include Rich Strike (3rd in Jeff Ruby) and Country House (3rd in Arkansas Derby, elevated by DQ).
Thus, a practical rule: downgrade any horse exiting a prep with a finish worse than 4th.
Synthesizing the Angles
Picking a Derby winner is about integrating signals, not clinging to one. Here’s how FFT, prep location, finish position, and Beyers can work together.
Step 1: Eliminate Non-Contenders
Toss horses exiting preps worse than 4th (unless an exceptional excuse).
Toss horses whose final 1⅛-mile prep splits are > 38 for 3/8 and > 13 for 1/8 (fail both FFT cutoffs).
This weeds out stamina-light sprinters and hopeless grinders.
Step 2: Prioritize Top Prep Sources
Give extra weight to horses coming out of Florida, Santa Anita, Arkansas Derbies.
Be cautious but not dismissive of Blue Grass / Wood / Louisiana.
Treat Jeff Ruby as fringe but viable.
Note: UAE Derby horses remain unproven on Derby day.
Step 3: Check Class Indicators
Ensure a minimum Beyer figure in the 95+ range somewhere pre-Derby.
Don’t demand 100+, but below-90 horses are almost never good enough.
Step 4: Look for “The Overlay”
Once you’ve narrowed the field to FFT-qualified, class-capable, prep-solid contenders, the key is identifying who’s being overlooked in the betting. Mage (15-1 in 2023) and Rich Strike (80-1 in 2022) both fit some signals (notably prep finish position and FFT at least partially) yet were dismissed on Beyer class alone.
Case Studies
Rich Strike (2022)
Prep: Jeff Ruby (3rd place).
FFT: Passed 3/8, failed 1/8 (36.89 / 13.08).
Beyer: Weak (84).
Odds: 80-1.
Lesson: Passing at least one FFT threshold and finishing top-3 in final prep gave him a puncher’s chance despite low Beyers.
Mage (2023)
Prep: Florida Derby (2nd).
FFT: Failed both (38.17 / 13.19).
Beyer: ~95.
Odds: 15-1.
Lesson: Rare FFT miss. Made up for it with tactical setup (fast Derby pace) and lightly raced upside. Reinforces that no system is infallible.
Mystik Dan (2024)
Prep: Arkansas Derby (3rd).
FFT: Passed both (37.76 / 12.69).
Beyer: Already >100.
Odds: 18-1.
Lesson: A textbook FFT success story. Even without a prep win, fractions and class screamed contender.
Sovereignty (2025)
Prep: Florida Derby (2nd).
FFT: Passed both (37.12 / 12.47).
Beyer: 96 pre-Derby.
Odds: 9-2 favorite.
Lesson: The prototype: FFT and Beyer in sync, strong prep, solid finish position.
Building a Derby Selection Strategy - Practical Checklist
Last Prep Placement: Was the horse top-4? If not, toss.
Fractions Test (FFT): Did it run <38 final 3/8 and <13 final 1/8?
Both = strong buy.
One = consider if price is right.
Neither = toss (unless extraordinary circumstance).
Prep Source: Did it come out of Florida, Santa Anita, Arkansas? Boost it.
Beyer Figures: Has it run at least a mid-90s Beyer? If not, caution.
Value: Are odds inflated relative to these signals? That’s your overlay.
Weighting the Factors
FFT: 40%
Prep location/finish: 30%
Beyer class: 20%
Intangibles (pace, trip, post, trainer/jockey form): 10%
Common Pitfalls
Overvaluing raw Beyers: A 100 Beyer looks impressive, but if the horse staggered home in 13.5, FFT says it may not last.
Chasing fashion preps: Don’t buy hype on UAE or “buzz horses” from minor preps without history.
Ignoring finish position: Horses that consistently fail to win/place in preps rarely flip the script in a 20-horse Derby.
Underestimating odds dynamics: The Derby is where bettors can find massive overlays; don’t be afraid to back FFT-qualified longshots.
Turning Data into Action
Handicapping the Kentucky Derby will never be easy. With 20 horses, pace chaos, and limited form, surprises will always happen. But history shows bettors can dramatically improve their odds by combining three proven filters:
Final Fractions Theory (FFT) — stamina-with-speed as a must-have.
Prep race trends — Florida, Santa Anita, Arkansas Derbies as the strongest launchpads.
Finish position — 1st–4th in final prep, with emphasis on 1st–2nd.
Layer in a sensible Beyer class floor and a healthy respect for odds value, and you have a practical framework.
In short: while you won’t pick the Derby winner every year, this approach keeps you on the right side of history most of the time — and gives you a fighting chance of landing the next 80-1 Rich Strike without chasing blind longshots.
That is the art of Derby handicapping: informed, disciplined, and always open to the race’s wild magic.


Created with © systeme.io
Privacy policy | Terms of use | Cookies